Thursday, April 21, 2022

Comparing Dallas City Council District Map proposals for winnability

Below is a chart of the Dallas City Council Redistricting maps being studied for selection by the Commission and then to use as a platform for any amendments needed. They are the maps that best achieve the Civil Rights goals of maximizing minority participation in our Dallas City Government. These maps produced the most districts that have the highest potential for selecting a minority candidate. It is clearly shown that 9 winnable minority districts are possible. It also shows that 5 winnable Black Districts are possible but not without destroying the potential for a 4th Hispanic District and a 9th winnable minority opportunity district.

In an attempt to measure winnability three different measurements were used: ppb, pph, and ppw. They tell the strength of a minority group in winning a district by telling you how many percentage points exist between the highest VAP (Voting Age Population) percentage racial/ethnic group in a district and the next highest percentage racial/ethnic group. It then identifies that second-place group as either Black, Hispanic or White-Non-Hispanic. This measurement system is used throughout the chart to achieve some objectivity. Since we know CVAP percentages are generally only about 61% of Hispanic VAP percentages but average over 30% higher than Black and White-non-Hispanic VAP percentages, we can make winnability estimations accordingly.
Obviously, this is only a crude measure, but it lends some level of objectivity to a very human process.
To double-check the calculations I have made in this chart it is recommended you randomly select any number in the chart and check it with the identified map
VAP data for the district you want to check. Please let me know immediately if you find any errors. I hope there are none, but it is very possible as this involved multiple calculations.
The numbers 1, 2, 3 & 4 at the top of the four columns for Black Districts and for Hispanic Districts are simply to identify the columns and not to be confused with district numbers. The goal is 4 winnable districts each plus the Minority Opportunity District in the last column as the ninth winnable district.
I value any questions you may have. The chart is below.

Saturday, March 26, 2022

Nine Winnable Minority Districts are Mandatory for the 2022-2031 Dallas City Council District Map

Nine winnable minority City Council Districts are Mandatory for the 2022-2031 Dallas District Map. This goal also allows Dallas to have a more compact map with fewer miles invested in district boundary lines separating neighborhoods.  Dallas White-non-Hispanic population has fallen from 47% in 1990 to only 28.1% in 2020.  Why cannot White-non-Hispanic districts be reduced to 5, or 36% of the 14 single-member districts while there are four minimum winnable districts for each the Hispanic community and the Black community with one minority opportunity district between them? 

While 71.9% of Dallas' population is made up of minority groups, with 9 seats redistricted to be winnable by the minority community that is only 64% of the 14 seats. 

Thursday, February 24, 2022

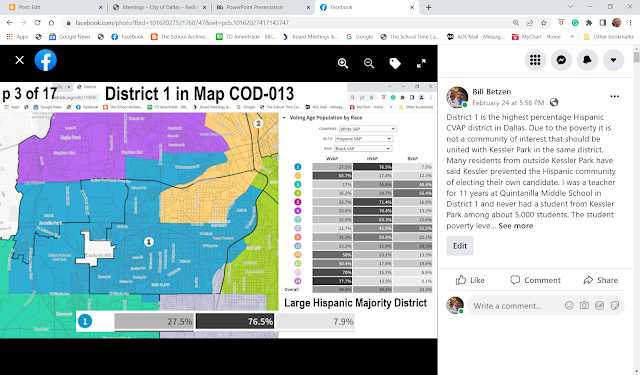
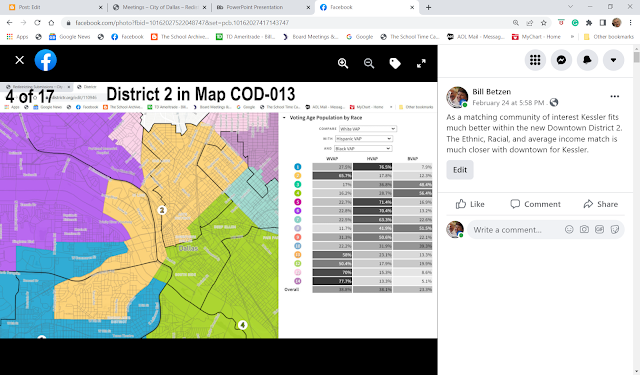
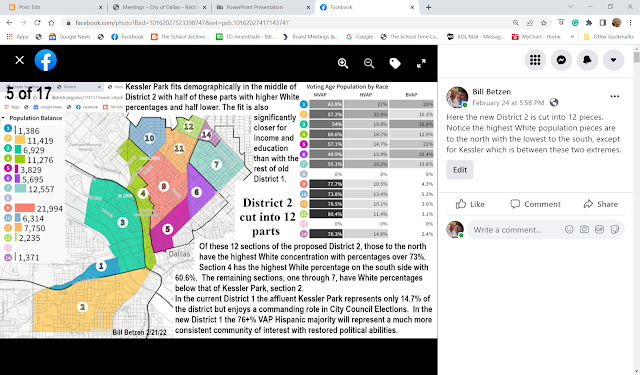
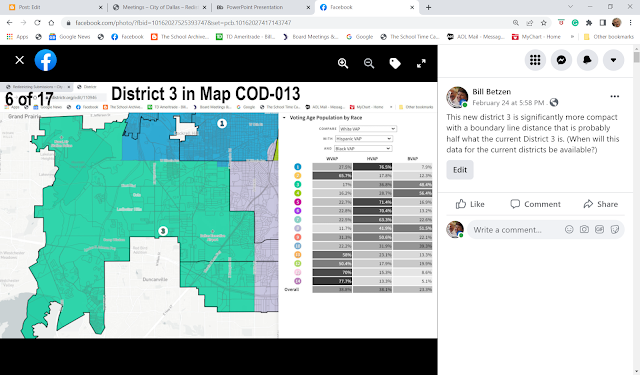
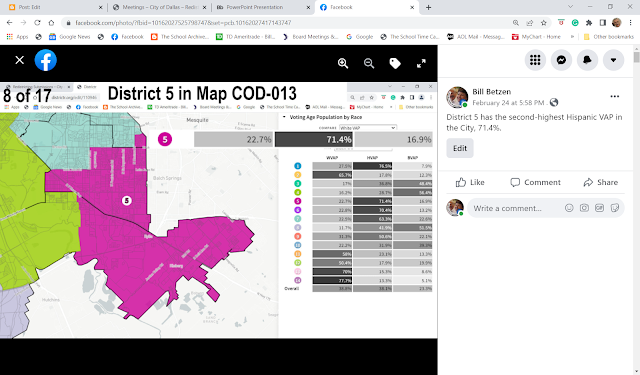
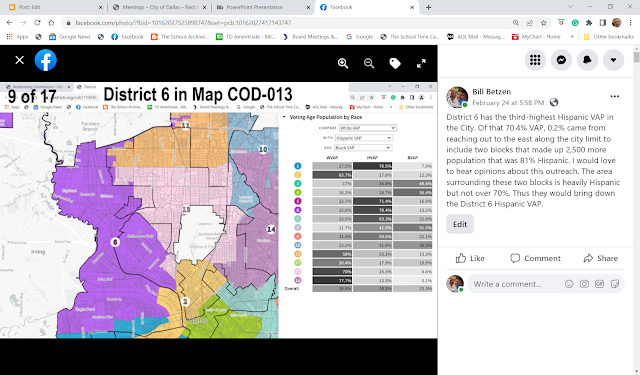
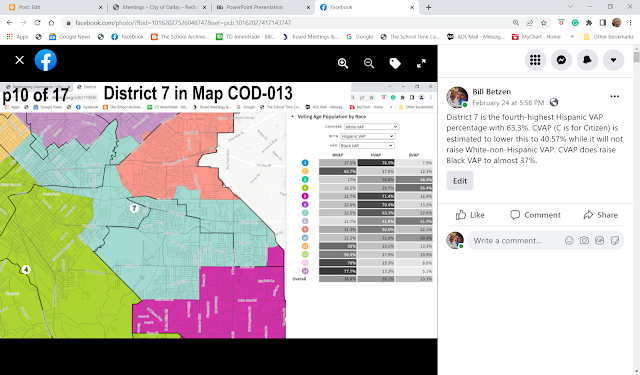
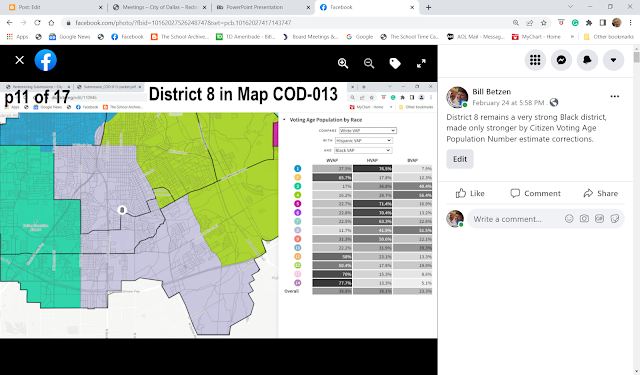
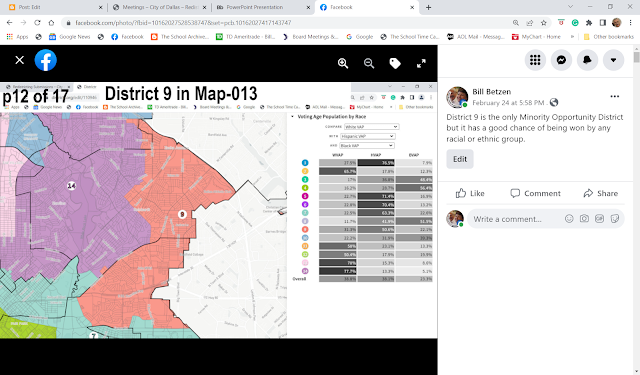
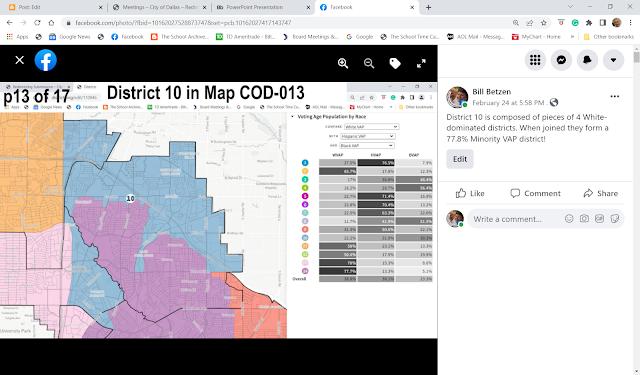
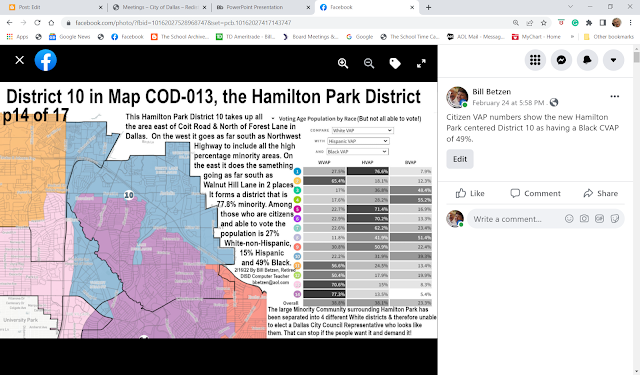
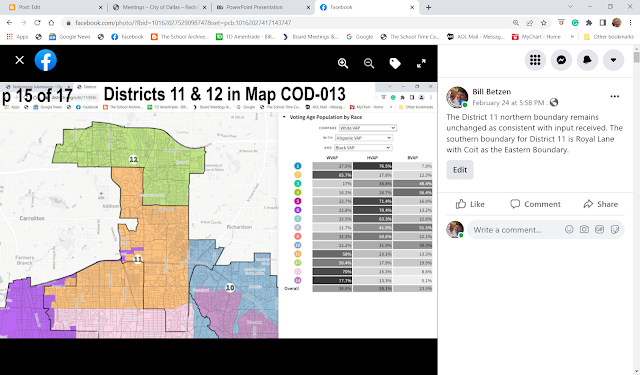
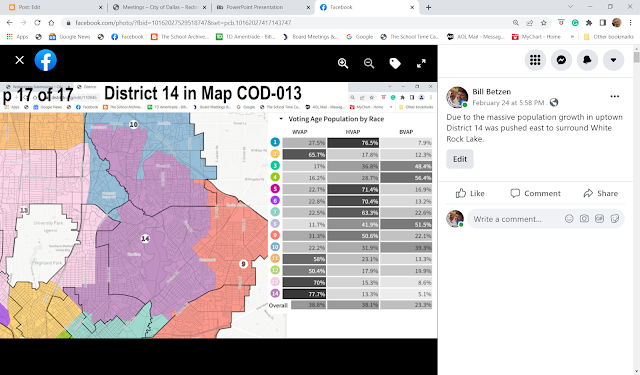
Redistricting Map COD-013 being presented 2/28/22 to Redistricting Commission

This is the Dallas City Council Redistricting Map named "COD-013" that I will be presenting at the 3:30 PM 2/28/22 meeting of the Dallas Redistricting Commissioners in the Dallas City Council Chambers in City Hall. Tragically, none of the 12 maps presented to the Dallas Redistricting Commission to date have provided 4 winnable Black districts or 4 winnable Hispanic districts!
Do not hesitate to take the "COD-013" map from the website, improve it, save it as yours, and submit it to the Redistricting Commission. That is how we improve maps! How to do it is all online at https://dallasredistricting.com/
. I welcome questions.


Your questions and comments are valuable.  My email is bbetzen@aol.com. You are also encouraged to speak with the Dallas Redistricting Commission.  They are listed with their email addresses at https://dallasredistricting.com/ where you can also load this COD-013 map and change this map as you like to submit as your own to the Commissioners.  We need more public involvement and more maps.
Bill Betzen 2/24/22

Friday, January 28, 2022

Dallas City Council Redistricting 2022 - opportunity for progress!

 I have been very involved for about 2 months in the Dallas City Council Redistricting Progress that is documented at https://dallasredistricting.com/meetings/

So far I have made 17 maps and now have 9 of the 14 City Council Districts in Dallas designed so that they have minority majorities (8) and one district is a strong Minority Opportunity District. Here is the data produced by Map #17:


However, along the way, I have been very frustrated to be one of the very few members of the public who are submitting maps.  To date, my map is the only one to make it through the submission process, but I am working to improve it. Part of that work is the map above.

Bill

Thursday, September 30, 2021

Some signs of gerrymandered Texas House, Senate, and Congressional Districts

Using demographic profiles to identify gerrymandering in any set of districts can be done easily.  Simply create a spreadsheet with the demographic profile for each planned district for the area to be redistricted. For the sake of simplicity dividing districts into White or Anglo-Non-Hispanic and Minority is the most rapid way in Texas to identify gerrymandering.  Here are the qualities to look for:

1) Does the Anglo Community endure the minimized loss with districts with under a 25% minority in almost 30% of districts, while at the same time the Minority Community endures maximized loss of votes with 75% or more majorities in 30% of districts, also known as packing.

2) Is there a gap in White Districts in the 30% to near 50% majority, while that same maximized loss range that is filled with Minority Majority Districts?  

3) In the Maximumized Win Range above 50% to 70% dominated by White Percentages in that range, but there are almost no Minority Districts with those valuable percentages?

These three questions help to outline maps that are gerrymandered.  These patterns NEVER happen by accident.


Saturday, September 18, 2021

Presentation to Texas House Redistricting Committee

 9/18/21 11:00 AM Presentation (It actually happened about 3:45 PM as I was # 44 in a list of 96 speakers listed to give 3-minute presentations.  We were mixed about equally with in-person presenters in Austin.)

I am Bill Betzen from Hereford & House District 86, but I have lived in Dallas Dist. 111 for the past 46 years. I want to send greetings to my Representative Yvonne Davis. I am a retired Computer Applications and Social Studies teacher speaking for myself. To date, I am against the lack of public involvement & transparency in this Texas Redistricting Process.

I was involved in the 2011 redistricting process. I ultimately developed a report on each of the three completed new maps for the Texas House, Senate, and the new Congressional map. I hope you have each received a copy of these one-page reports and have them before you. (See below.) If you google "Bill Betzen blog", you will find my blog where they are posted with today’s testimony.

The methods are the same in each report. It requires the demographics from each district given in two numbers, the White-non-Hispanic percentage, which I will call White from now on, and the Minority percentage. This list is ordered in a spreadsheet from the lowest White percentage district to the highest White Percentage District. A very telling pattern is immediately exposed!

But first, let’s talk about the value of votes. If you want your group to win most of the 150 seats, then you want to use their votes as efficiently as possible. That means you want just enough votes in each district to win as many districts as possible with as few votes as possible used in each district. Consequently, districts with your group in the percentages just over 50%, but not too far above 70% so as to “waste” votes, is what you want. Consequently, districts with percentages from 50% up through 70%, and sometimes as high as 75%, use votes most efficiently.

You want to avoid districts that waste your group's votes. Thus, you do not want districts wherein your group falls into the 25% to 50% range and potentially “wastes” votes in lost elections. An abundance of such districts in a redistricting map, such as happened repeatedly to Texas Minority voters in 2011, is called cracking. You also want to avoid districts with your group’s percentages falling over 75%, called packing. Yes, you win them, but you have overkill. You have wasted votes that could have been used to win more districts. This happened repeatedly to Minority voters with the gerrymandered 2011 maps.

The three reports before you document gerrymandering patterns in 2011. Just look at the House Report. The high-value district percentages from 50% to 75% were not evenly distributed. The Texas Minority communities enjoyed these percentages in only 31 districts. White communities enjoyed such "maximum efficiency" in 70 districts with such 50% to 75% percentages.

On the other side, the packed districts that waste the most votes were disproportionately Minority districts! There was only one district with a White percentage of 85% or above while there were 17 such minority districts!  

These patterns must not repeat in 2021!


Wednesday, August 18, 2021

School Time Capsule Postmasters Needed!

Want to make possible a system that helps hundreds of parents write letters to their child every year about their dreams for their child and sharing family history stories?  Imagine the priceless family conversations such letters could generate!

Want to help children write their plans for their own futures every year during the decade before they graduate high school?  Imagine if you had copies of such plans you had written from 3rd through 12th grade! Would you be a different person because of such a future focus?

Want to help parents connect their children with their family roots, their history?   Imagine if you now had such written family stories from your parents, grandparents, and other relatives. Imagine the value of such written family stories! Imagine the stories that went to the grave with your older relatives as no grandchild, niece or nephew had asked for stories from family history to be written in letters back to them.

Want to help students experience the power of writing?

This writing exercise, carried forward year to year by your volunteer "Time Capsule Postmaster" work, will show students the power of writing.  Writing is too often the weakest link in the education of our students!

These goals are possible!

Simply helping letters that students, parents, and other important relatives write, to get back to the student a year, or a decade later, makes it all possible!

Imagine handing out year-old letters to 5th graders.  Year-old letters are very old to such students.

Volunteer School Time Capsule Postmasters are needed to help these goals be achieved! Their work makes a system possible that focuses both students and parents on their own roots & goals, year by year, from pre-k through graduation.  They help the 10-year class reunions happen!

Some of those attending the ten-year reunion May 2, 2017 for Quintanilla's 8th grade class from 2007.


Each postmaster invests possibly 50 hours a year helping store hundreds, if not thousands of letters parents and students write for the School Time Capsule Vault, a large 500 to 700-pound vault usually placed in the school lobby, a place students and parents pass it as often as possible. 

If their local school does not yet have a vault and a School Time Capsule Project, they can help raise the $900 needed with the PTA. The fundraising process helps introduce parents to the project.  The school can now order the 700-pound vault from Costco.com, delivered, for $900. The postmaster(s) helps train school staff, especially the Language Arts teachers, about this set of two annual writing projects for students.

It begins with pre-k enrollment when each parent is asked to write a letter to their child about their dreams for them. The letters are written each year and go into the vault in the envelope for each child.

This process changes by the third grade when two annual writing assignments begin. Students write a letter to each of their parents, and may expand in later years to favorite relatives, especially grandparents. Students write to ask for letters back about dreams the writers have for the student and for a story from the writer's personal history. Students should always immediately read letters they receive back. They then ask the writer any questions they may have.  Hopefully this will lead to those priceless conversations we should have more often with our children and grandchildren.

Honorable Trini Garza, former DISD Trustee and Bill Betzen on 1-17-19,
with the old 2005 Quintanilla vault and the new 700-pound vault.
Too many letters for the old vault! Nice problem! Since 2015 Quintanilla has
consistently remained one of the 5 best of all 33 DISD middle schools.
The second writing class is when students prepare the self-addressed envelope to hold the letters collected.  Then the student writes a letter to themselves about their own plans for the future while the postmaster and teacher double check addresses on the envelopes. (Such accuracy is critical!) 

A year is a very long time. Students change significantly.  Thus the "Time Capsule" term is appropriate from the perspective of both the student, and their parents who see the massive year-to-year changes every child's life reflects.

Postmaster(s) make this system possible. They manage the archiving system so that they can personally hand back to each student the envelope they prepared a year earlier.  They will see that twinkle in the student's eye as students try to remember what they wrote a year earlier.

The letter writing starts as parents write their first letter to their child about their dreams for them.  This letter goes with the pre-k application. It is the first of 14 annual letters to their child about their dreams for them.  These letters will develop and gain detail as their child grows.

The Postmaster(s) will also help for the special 10-year-in-the-future dreams and plans that happen in the 8th grade, and then again in the 12th grade.  They will ultimately be helping to coordinate those 10-year 8th grade and 12th grade class reunions.  At the high school level they may simply staff the "Time Capsule Table" at the traditional high school 10-year reunion.  They will pass back the letters written 10-years earlier.

2015 was first 10-year reunion for the first Time Capsule Project Class of 2005.
2015 was also the year Quintanilla had the highest DISD School Effectiveness
Indices (SEI) Score of any DISD middle school, for the first time! System
improvements now speed up such improvement to three years, not 10.

I personally consider this to be the most rewarding volunteer work possible.  You will see a school change before your very eyes!  Your work allows students to begin to know in more detail their own family roots and make their own plans for the future, updating their plans every year.  Grades and behavior both improve! Student confidence grows!  Then you see tears of joy at the class reunions as they are thankful and celebrate what they have achieved.

Please call the Dallas ISD Volunteer Center (972-925-5440) about becoming a Time Capsule Postmaster. You may even help start such a project in a school you want to change. Use the word "Postmaster" and they will know what you are calling about.

To see more details about the project, read the manual that is found at www.StudentMotivation.org.

This is an open source project that is ran independently by each school.  We only ask that Project improvements discovered be shared.

Bill Betzen, bbetzen@aol.com